
Power BI vs Tableau vs Qlik: The 2026 Comparison Every CIO Bookmarks Before Making a Decision
Last Updated : 11/08/2026
Estimated : 15 min read
Author : Lokesh A
Table of Content
- Introduction
- The 2026 BI Landscape: What Has Changed for Each Platform
- Criterion 1: Pricing and Total Cost of Ownership
- Criterion 2: AI Integration and Embedded Intelligence
- Criterion 3: Visualisation Depth
- Criterion 4: Ecosystem and Data Connectivity
- Criterion 5: Governance and Enterprise Security
- Which Platform Is Right for Your Organisation?
- Governance, Security, and Enterprise Administration
- A Decision Framework: Which Platform, and When
- How VeeTee Helps Teams Choose and Implement BI
- Conclusion
- Get a platform-neutral BI assessment
- Frequently Asked Questions (FAQ)
Introduction
Enterprise BI is no longer evaluated once every five years. In 2026, the market has shifted dramatically — Microsoft folded Power BI into the broader Fabric analytics platform, Salesforce transformed Tableau into an AI-driven insights engine with Tableau Pulse and Einstein Discovery, and Qlik absorbed Talend to unify data integration and analytics under one administration console. Three platforms, three philosophies, and one decision that will shape how your organisation makes data-driven decisions for the next three to five years.
This comparison is written for CIOs, data directors, and IT leads who need an honest, implementation-grounded picture — not a vendor's marketing page. We cover real enterprise total cost of ownership, AI integration, governance, and ecosystem fit, then give you a framework to make the call. VeeTee'sPower BI consulting practiceworks with enterprise teams across all three platforms, so what follows reflects real implementation experience rather than vendor marketing.
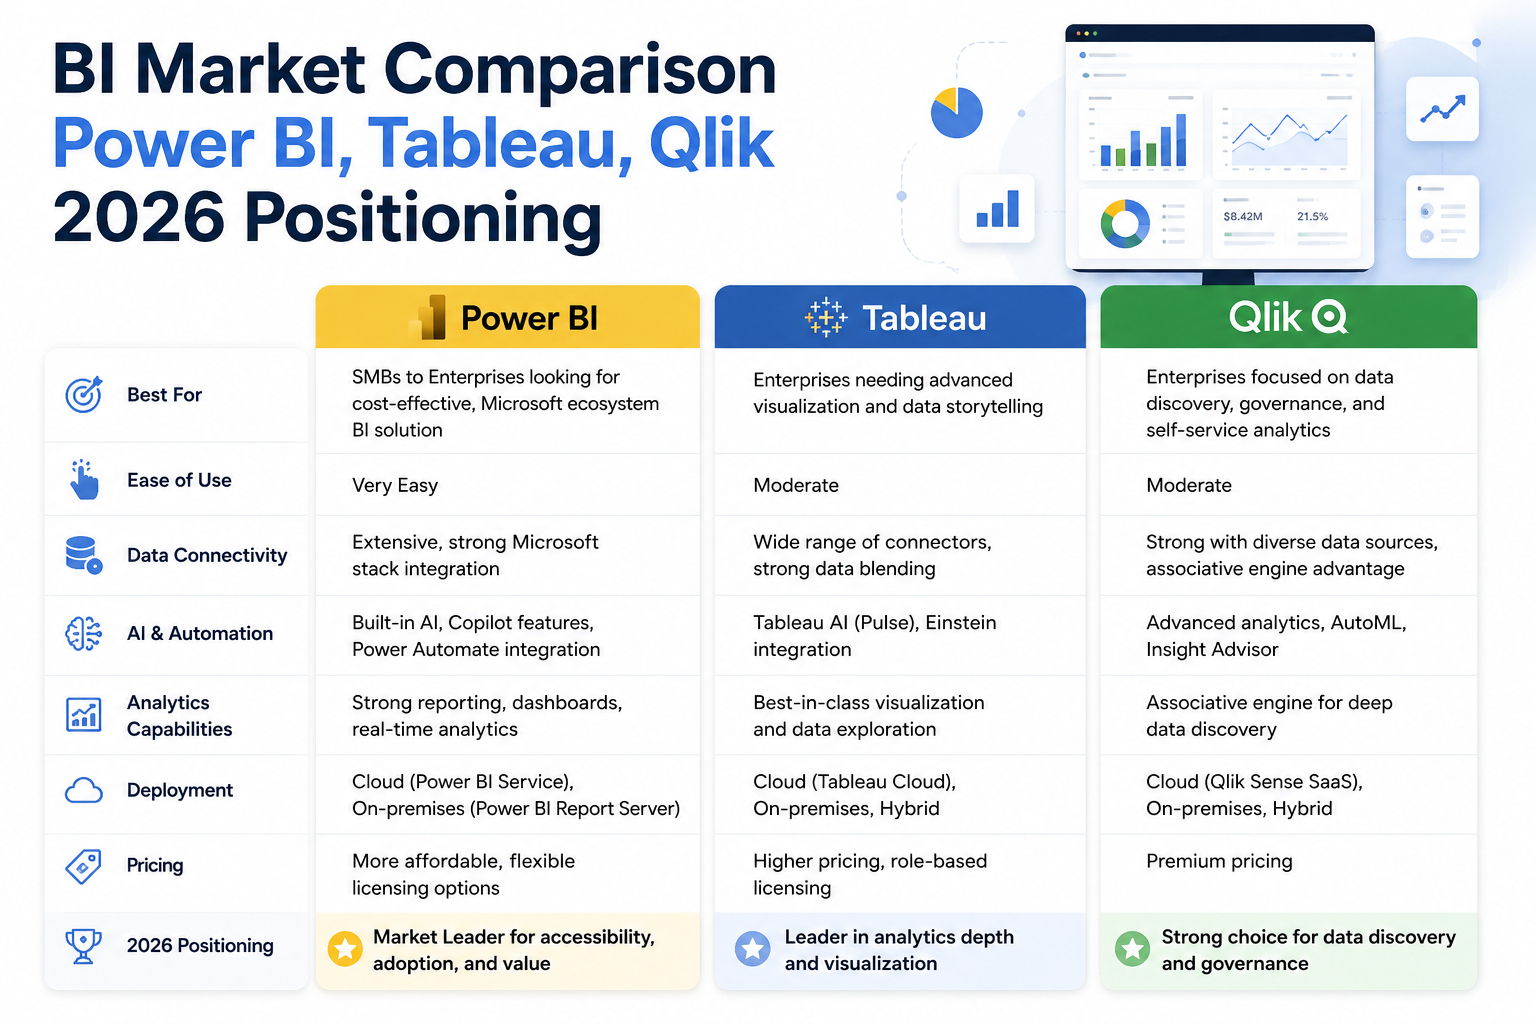 BI market positioning in 2026: how Power BI, Tableau, and Qlik differ in philosophy and market share
The 2026 BI Landscape: What Has Changed for Each Platform
Power BI: the reporting layer of Microsoft Fabric
Power BI's most significant development is Microsoft Fabric — a unified data analytics platform that brings together data engineering, data warehousing (Synapse), real-time analytics, data science, and Power BI reporting under a single SaaS experience and single billing line. For Microsoft-standardised organisations, Power BI in 2026 is the analytics layer of an integrated stack that competitors cannot replicate by bundling third-party tools.
Tableau: from visualization tool to AI insights engine
Tableau, now fully embedded in the Salesforce ecosystem, has pivoted from a visualisation tool to an AI-driven analytics platform. Tableau Pulse delivers proactive metric monitoring and natural-language summaries directly to users through Slack, email, and Salesforce. Einstein Discovery adds predictive recommendations to existing dashboards. For Salesforce-heavy enterprises, Tableau's integration with Salesforce Data Cloud creates a unified CRM-to-analytics pipeline.
Qlik: analytics and data integration on one licence
Qlik completed the integration of Talend into its unified administration console in February 2026, creating the only major BI platform that covers both data integration (ETL/ELT, CDC replication from Oracle, SAP, SQL Server, and mainframes) and analytics in a single license. As Metrica Software's 2026 BI platform ranking notes: 'Qlik avoids the vendor lock-in question that the other platforms raise' — a positioning that resonates with CIOs running heterogeneous cloud environments.
Criterion 1: Pricing and Total Cost of Ownership
Power BI remains the most affordable enterprise BI option. Power BI Pro costs $14 per user per month. At Microsoft Fabric F64 capacity or higher, unlimited report viewers are served at zero per-user cost. According to IQRATechnology's 2026 BI pricing analysis, a 500-user deployment mixing 20 PPU creators with Fabric capacity lands in the $85,000–$100,000 annual range.
Tableau's equivalent 500-user deployment runs approximately $270,000 per year at Standard edition pricing, and above $420,000 at Enterprise tier — three to five times the Power BI cost. EPC Group's migration study, based on 25+ completed Tableau-to-Power BI migrations, documents typical 3-year TCO savings of $400,000 to over $2 million for large enterprise migrations. Qlik shifted to capacity-based pricing in April 2025: its Standard plan starts at $825 per month for unlimited users with 25 GB of data, making Qlik cost-competitive at 200+ users.
Qlik shifted to capacity-based pricing for new customers effective April 2025. The Standard plan starts at approximately $825 per month for unlimited users with 25 GB of data, making Qlik cost-competitive at scale — typically 200 users and above, where per-seat pricing becomes prohibitive. For large enterprises needing both analytics and data integration, Qlik's combined platform can represent a better total cost of ownership than licensing Tableau plus a separate ETL tool.
Criterion 2: AI Integration and Embedded Intelligence
Power BI Copilot, native within Microsoft Fabric, lets users create reports and generate data summaries using plain-English prompts — directly bound to Fabric data without an external API or additional subscription. Tableau Pulse takes a push-based approach: it monitors key metrics continuously and delivers anomaly alerts and natural-language summaries through Slack, Teams, and email. Qlik Insight Advisor uses the associative engine to surface correlations and patterns that analysts were not originally looking for — the AI extends the platform's core discovery philosophy rather than adding a separate AI layer on top,
Criterion 3: Visualisation Depth
Tableau retains the gold standard for visualisation sophistication — built visualisation-first, with Viz in Tooltip, Story Points, and the broadest chart palette. Power BI has closed the gap significantly. Team Computers' 2026 comparison concludes: 'Tableau was built visualization-first. Power BI was built data-model-first. That architectural difference still shows in 2026, though Power BI has closed the gap significantly.' Qlik's charts are functional and analytics-grade; the platform's primary differentiation is the associative engine, not visual aesthetics.
Criterion 4: Ecosystem and Data Connectivity
Power BI's depth of integration with Azure, SQL Server, Dynamics 365, Teams, and Fabric is unmatched for Microsoft-standardised enterprises. DirectLake mode eliminates data copies, delivering real-time freshness that Tableau extracts cannot match without additional infrastructure. Tableau's native connectors for Salesforce Data Cloud, AWS Redshift, and Google BigQuery give it the edge in Salesforce-centric and multi-cloud environments. Qlik's cloud-agnostic positioning, with Talend handling CDC replication from Oracle, SAP, and mainframes, is its strongest card for organisations with complex legacy data landscapes.
Criterion 5: Governance and Enterprise Security
All three platforms support row-level security, SSO, and role-based access control. Power BI's integration with Microsoft Purview provides end-to-end data governance, sensitivity labelling inherited from Microsoft Information Protection, and full data lineage across the Fabric stack. Tableau's Data Management Add-on and Tableau Catalog cover data lineage and quality warnings. For regulated industries (financial services, healthcare), Power BI's Microsoft-native governance layer is a measurable compliance advantage.
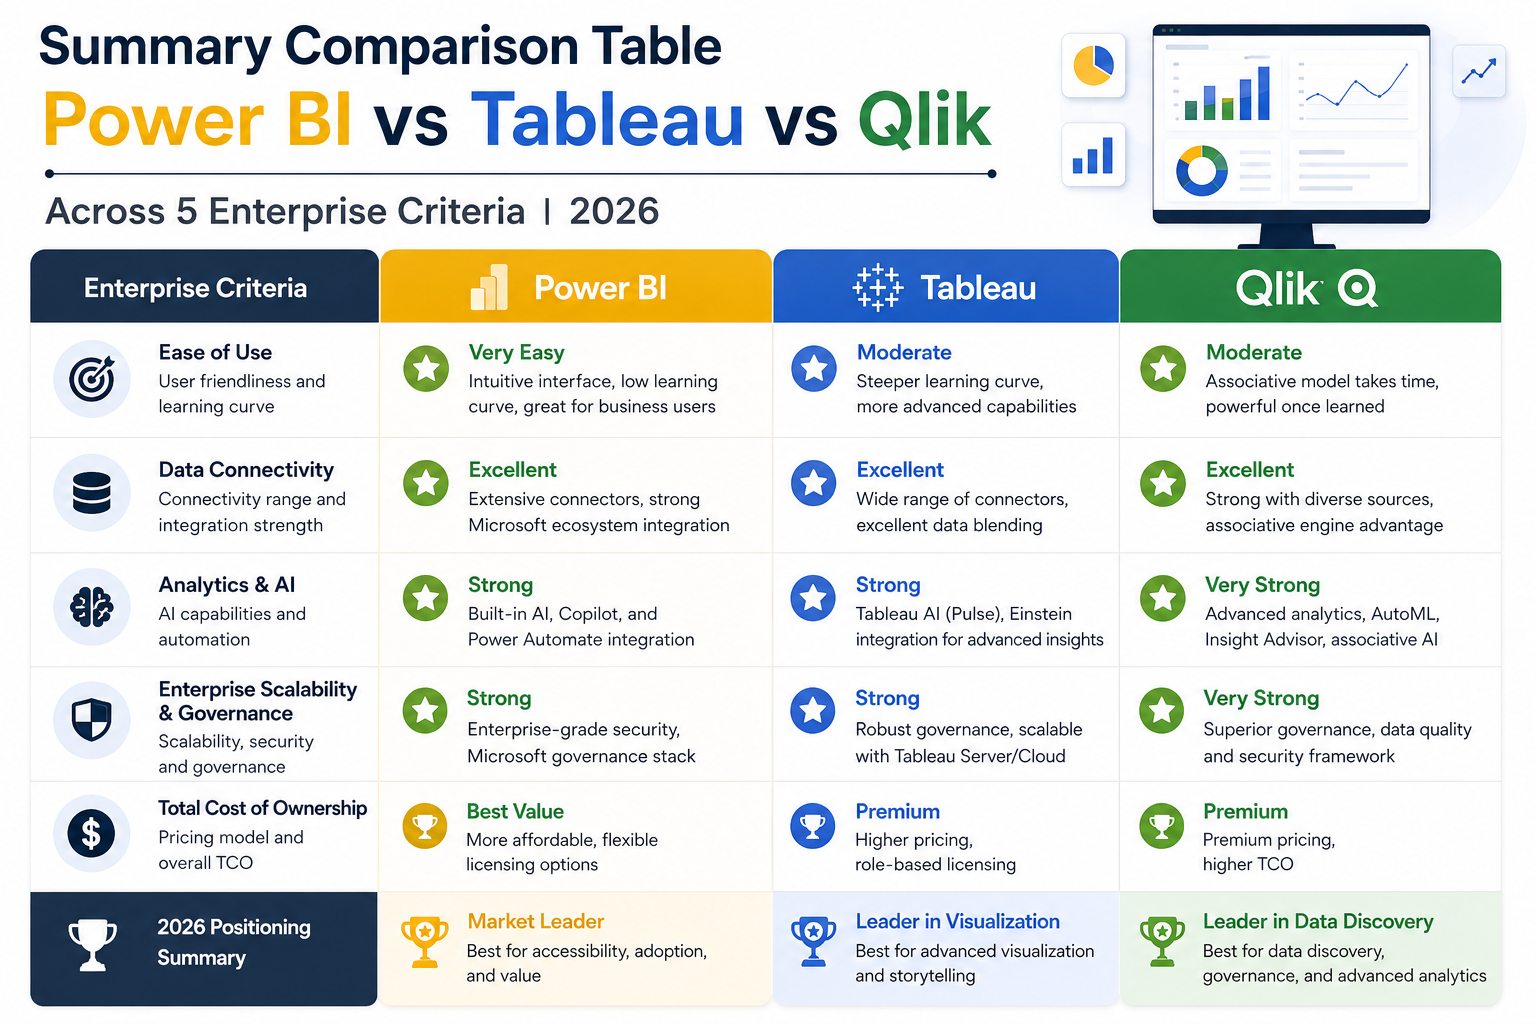 Decision matrix: which BI platform for which enterprise scenario 2026
Which Platform Is Right for Your Organisation?
| Your Situation | Recommended Platform | Key Reason |
|---|---|---|
| Microsoft 365 / Azure standardised | Power BI + Microsoft Fabric | Tightest ecosystem, best TCO, Copilot built in |
| Salesforce-heavy enterprise | Tableau | CRM-to-analytics pipeline, Tableau Pulse |
| Multi-cloud / heterogeneous landscape | Qlik | Cloud-agnostic + Talend data integration |
| Budget-constrained, 200+ viewers | Power BI | Fabric capacity pricing eliminates per-viewer cost |
| Complex data discovery needs | Qlik | Associative engine surfaces patterns others miss |
| Advanced visualisation quality | Tableau | Still the strongest visual design toolkit |
Governance, Security, and Enterprise Administration
All three platforms support row-level security, single sign-on, and role-based access control. The differentiators emerge at the governance and data lineage level. Power BI's integration withMicrosoft Purviewprovides end-to-end data governance, sensitivity labelling inherited from Microsoft Information Protection, and full lineage across the Fabric stack — from source system through to published report. For regulated industries such as financial services, healthcare, and pharmaceuticals, that Microsoft-native governance layer is a significant advantage.
Tableau offers robust governance through Tableau Data Management and Tableau Catalog, including lineage, quality warnings, and certified data source labelling. For Salesforce-centric organisations, governance extends naturally into Salesforce's trust model and Shield platform encryption. Qlik's governance is built around its associative security model, which many administrators find more intuitive for managing complex permission structures across large user bases.
| Criterion | Power BI | Tableau | Qlik |
|---|---|---|---|
| Cost at enterprise scale | Strongest | Weakest (3–5x premium) | Strong above ~200 users |
| AI approach | Copilot — prompt-based, native to Fabric | Pulse — push-based alerts and summaries | Insight Advisor — associative discovery |
| Visualization depth | Very good, gap narrowing | Best in class | Functional; exploration over polish |
| Ecosystem fit | Microsoft / Azure estates | Salesforce and multi-cloud estates | Cloud-agnostic; Oracle, SAP, mainframe |
| Governance and lineage | Purview, end-to-end across Fabric | Data Management and Catalog | Associative security model |
A Decision Framework: Which Platform, and When
Strip away the feature matrices and the choice usually resolves on ecosystem gravity, user mix, and whether you need data integration in the same licence. Use these as decision rules rather than preferences:
- Choose Power BI if your estate is Microsoft-aligned, your viewer-to-creator ratio is high, and cost predictability at scale matters. Fabric capacity turns viewer licensing from a growing per-seat line into a fixed one — the single largest structural cost advantage in this comparison.
- Choose Tableau if you are Salesforce-native, if executive-grade visual storytelling is a genuine business requirement rather than a preference, or if proactive metric monitoring through Pulse changes who in your organisation actually consumes analytics.
- Choose Qlik if your data landscape is heterogeneous — Oracle, SAP, mainframe, multi-cloud — if you would otherwise buy a separate ETL/CDC tool alongside your BI platform, or if avoiding single-vendor gravity is an explicit architectural principle.
- Stay where you are if your current platform is governed, adopted, and meeting business demand. A migration consumes 16 to 26 weeks of analytics team capacity that could otherwise ship new reporting. Licence savings alone rarely justify that opportunity cost unless the three-year gap is substantial.
How VeeTee Helps Teams Choose and Implement BI
VeeTee's data analytics practice provides platform-neutral BI assessment and implementation services. We compare your existing data landscape, integration requirements, and budget against all three platforms before recommending a path. Our Power BI consulting team has delivered dashboards, Fabric architecture designs, and Tableau-to-Power BI migrations for enterprise clients across India, UAE, and the UK.
Conclusion
There is no universally correct answer in 2026 — but there is a correct answer for your estate, and it is usually determined before the feature comparison begins. Ecosystem alignment, your viewer-to-creator ratio, and whether data integration sits inside or outside the BI licence will settle the decision more reliably than any dashboard bake-off. Establish those three facts first, then let the demos confirm the choice rather than drive it.
Get a platform-neutral BI assessment
Before you commit to a three-year licensing agreement, get an independent read on which platform fits your data landscape, your user mix, and your budget.Contact our analytics teamfor a BI platform assessment and a costed implementation or migration roadmap.
Frequently Asked Questions (FAQ)
Is Power BI free to use for enterprises?
Is Power BI free to use for enterprises?
Power BI Desktop is free for individual local report building. Sharing reports across the organisation requires Power BI Pro at $14 per user per month, or Microsoft Fabric capacity (F SKUs) which can serve unlimited viewers without per-seat cost at scale. Most enterprises already licensing Microsoft 365 E5 get Power BI Pro included in that bundle, making the effective incremental cost zero for report consumers.
What is Microsoft Fabric and how does it relate to Power BI?
What is Microsoft Fabric and how does it relate to Power BI?
Microsoft Fabric is a unified analytics platform that includes Power BI as its reporting layer, alongside data engineering (Data Factory), data warehousing (Synapse Warehouse), real-time analytics, and data science — all under one SaaS licence and one governance model. In 2026, Power BI is increasingly the front-end of Fabric rather than a standalone tool. DirectLake mode within Fabric delivers real-time data access to Power BI reports without data imports, which is a meaningful performance advantage over traditional import-mode datasets.
Is Tableau still worth its premium over Power BI in 2026?
Is Tableau still worth its premium over Power BI in 2026?
For Microsoft-aligned enterprises, the honest answer in most cases is no — the 3–5x licensing premium is difficult to justify when Power BI's feature set has converged significantly. Tableau remains the better choice if your organisation is Salesforce-native, has complex multi-source data storytelling needs, or relies heavily on Tableau Pulse for proactive monitoring. The most robust approach is a platform-neutral assessment before committing to either, which is what VeeTee's BI consulting practice provides.
How long does a Tableau to Power BI migration take?
How long does a Tableau to Power BI migration take?
Based on EPC Group's migration data, migrating 50–200 Tableau workbooks takes 16–26 weeks end-to-end, with 70–85% automated and the remainder — particularly complex LOD expressions and custom SQL — requiring manual rebuild. The most common cause of timeline overrun is underestimated data model complexity, not visualisation recreation.
Which BI platform is best for companies in India or UAE?
Which BI platform is best for companies in India or UAE?
For Indian enterprises with Microsoft licensing via EAs or CSPs, Power BI offers the strongest value — pricing, Copilot in Hindi, and the Microsoft ecosystem already present in most organisations. UAE enterprises benefit from Power BI's Azure regional data residency options. Qlik is strong where Oracle or SAP data integration drives the requirement, which is common in manufacturing and distribution sectors across both markets. VeeTee Technologies serves enterprise clients across both markets and can provide region-specific licensing guidance.
Get in Touch
Contact Us
+91 9500945700
adm@vttech.in
No: 8/65, 1st Floor, Radhakrishnan Street, Shankaran Avenue, Velachery, Chennai, Tamil Nadu – 600042, India.
We’re here to help you !