
How to Actually Measure Data Analytics ROI: A Framework for Business Leaders Who Need Real Numbers
Last Updated : 27/08/2026
Estimated : 11 min read
Author : Lokesh A

Table of Content
- Introduction
- Why 95% of Analytics Projects Can't Prove Their Own Value
- The Three-Pillar Framework for Measuring Real Analytics Value
- The Single Question That Filters Out Vanity Metrics
- Define Success Before the Project Starts, Not After It Ships
- Start With a Pilot, Not a Platform
- Who Should Own the Number After Go-Live
- Looking Ahead: How ROI Measurement Itself Is Evolving
- How VeeTee Structures Analytics Engagements Around Provable ROI
- Frequently Asked Questions
Introduction
A business intelligence project ships on time, on budget, with a genuinely impressive-looking dashboard. Six months later, when a CFO asks what it actually delivered, the honest answer inside most organisations is a long pause followed by usage statistics — how many people logged in, how many reports were viewed — none of which answer the question that was actually asked. This is not a rare failure. It is close to the default outcome, and it traces back to a single root cause: nobody defined what "success" meant in terms a business leader would recognise before the project started.
This guide gives business leaders, analytics sponsors, and CFOs a practical framework for defining and measuring analytics ROI properly — before a project begins, not as an uncomfortable retrospective exercise once budget has already been spent.
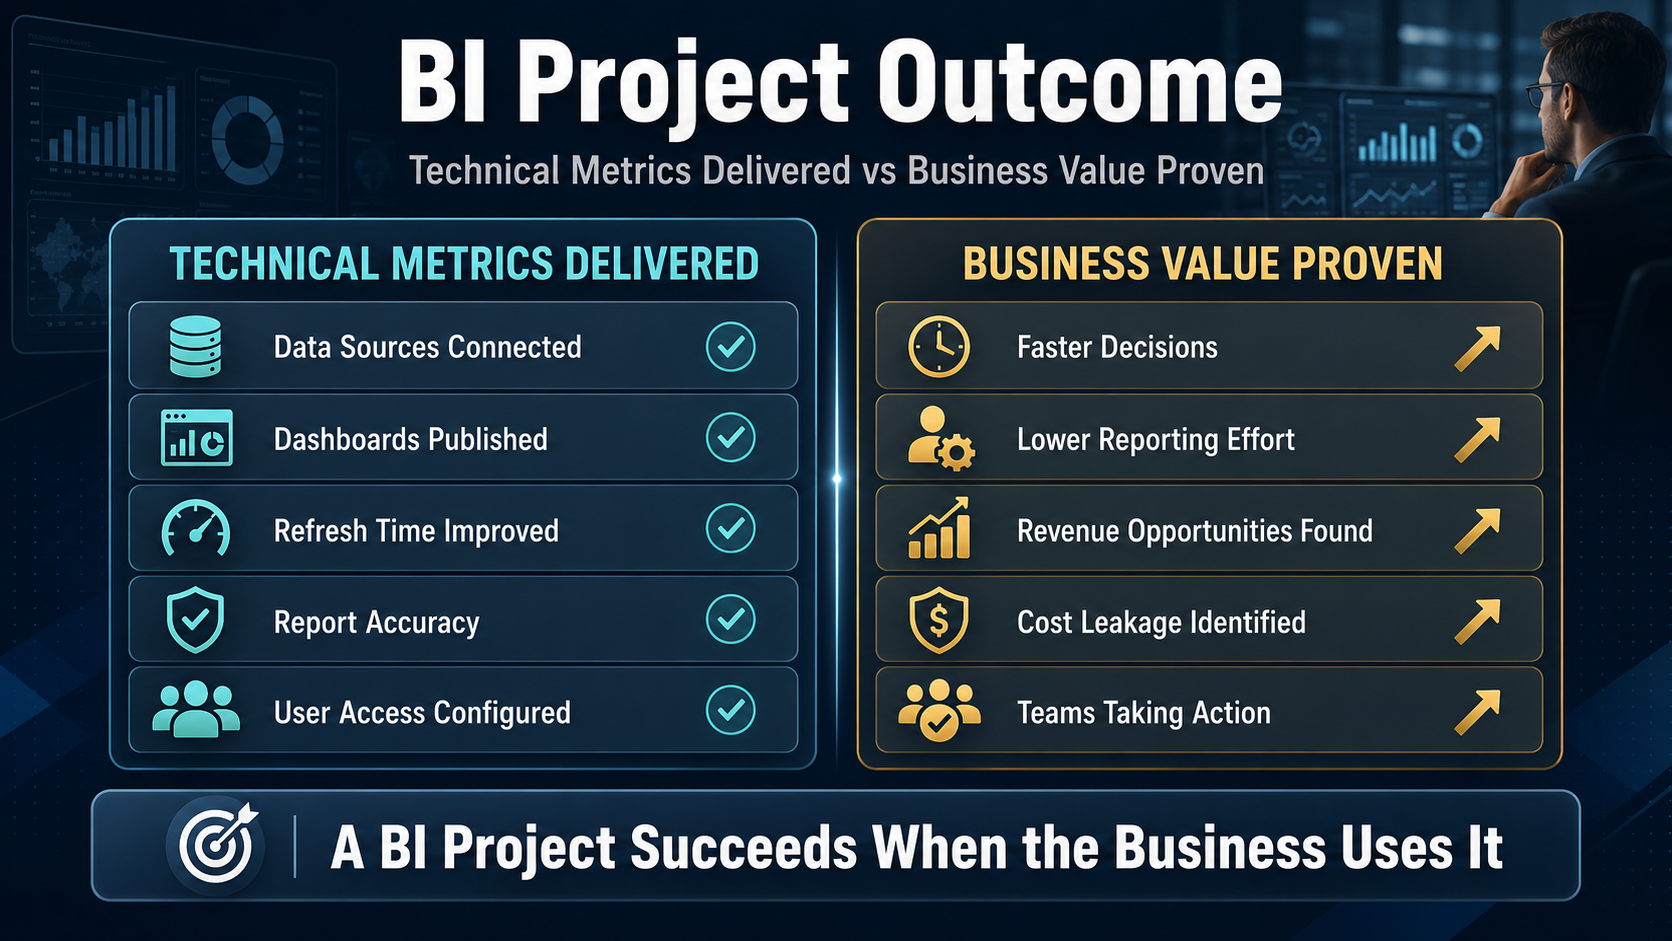 BI project outcome split: technical metrics delivered vs business value proven
Why 95% of Analytics Projects Can't Prove Their Own Value
The scale of this problem is larger than most business leaders assume. Industry analysis of enterprise analytics initiatives finds that 95% of analytics projects fail specifically because they cannot connect their data outputs to a business outcome — not because the underlying technology failed, and not because the data was wrong. The dashboards work. The models run. Nobody can point to a rupee, dollar, or dirham of measurable business impact, because the project was never instrumented to capture one.
This is not confined to analytics specifically. Gartner projects that by 2027, 80% of data and analytics governance initiatives will fail, and BCG's study of over 850 companies found digital transformation projects achieving only a 35% success rate globally. The pattern connecting all three findings is the same: technical delivery and business value are being measured, when they are measured at all, as though they were the same thing. They are not. A dashboard with 94% uptime and daily active usage from half the sales team is a technical success. Whether it changed a single pricing decision, inventory order, or customer retention outcome is an entirely separate question — and it is the only one a CFO actually cares about.
The Three-Pillar Framework for Measuring Real Analytics Value
A workable analytics ROI framework organises value into three distinct pillars, and every metric your project tracks should map clearly to one of them. This structure — used across analytics programmes that have achieved documented 300–4,600% ROI within 90 days — works precisely because it forces every proposed metric through a simple filter before it is adopted: does this number represent money made, money saved, or risk avoided? If the honest answer is none of the three, the metric measures activity, not value.
- Direct Revenue Impact: incremental revenue directly attributable to a decision the analytics made possible — a pricing change informed by demand elasticity analysis, a cross-sell recommendation engine, a churn-prediction model that triggered a retention offer before a customer left.
- Cost Avoidance: measurable reduction in operating cost enabled by the analytics — inventory carrying cost reduced through better demand forecasting, headcount hours saved through automated reporting that previously required a manual data-pull process, fewer stockouts or overstock write-offs.
- Risk Mitigation: exposure reduced or compliance strengthened — fraud caught earlier through anomaly detection, a safety incident predicted and prevented, an audit finding avoided because data lineage and governance were now traceable.
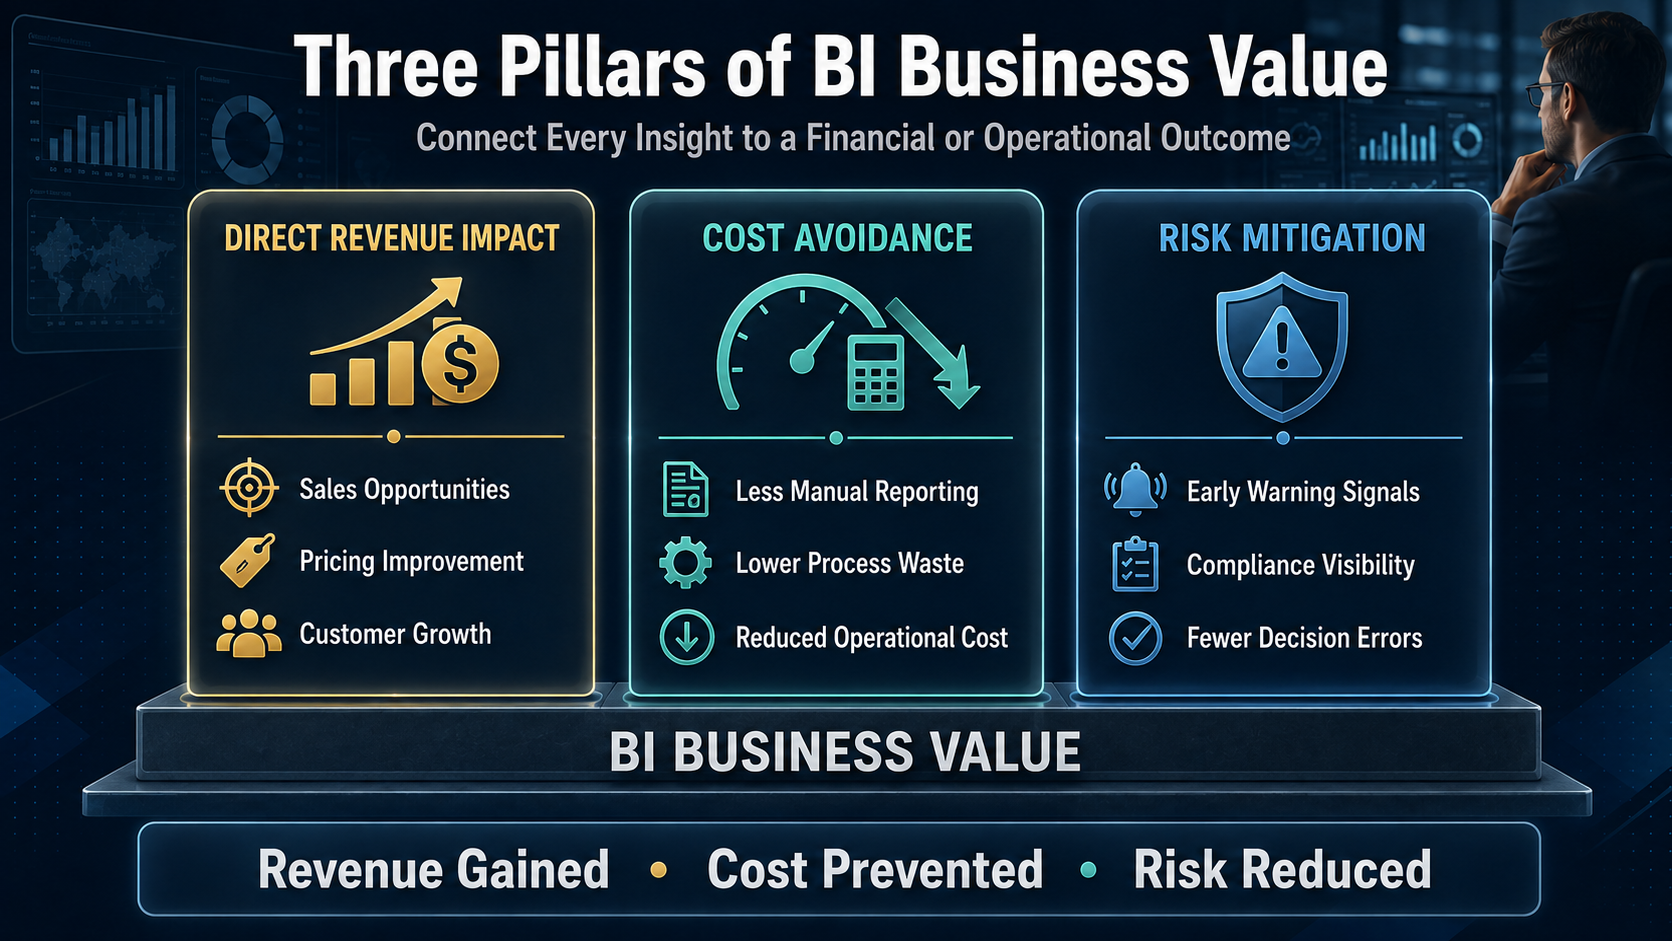 Three pillar diagram: Direct Revenue Impact, Cost Avoidance, Risk Mitigation
The Single Question That Filters Out Vanity Metrics
Activity metrics make a project feel productive. Outcome metrics prove it was valuable, and the two are frequently confused inside the same project status report. Number of dashboards built, number of active users, number of reports scheduled, and query response time are all legitimate operational health indicators — they are not evidence of business value on their own. The discipline that separates analytics programmes that can defend their budget from those that cannot is a simple, repeatable test applied to every proposed metric before it is adopted: "so what?" If a dashboard shows that regional sales managers viewed a report 40 times last month, the immediate follow-up question is what decision changed because of those 40 views — and if nobody can answer that specifically, the metric is not yet measuring value.
Define Success Before the Project Starts, Not After It Ships
The single highest-leverage moment in any analytics project's entire lifecycle is the discovery phase, before a single dashboard is designed or a single model is trained. Projects that lock specific, measurable success thresholds during discovery — for example, a target reduction in stockout incidents, a specific percentage improvement in forecast accuracy, or a defined dollar figure in recovered working capital — put themselves in a fundamentally different position at go-live than projects that start build first and figure out what "success" means later. When metrics are agreed and instrumented from day one, the team knows exactly where it stands within weeks of launch, and the executive conversation becomes about what to do next rather than a retroactive, often uncomfortable debate about whether the project worked at all.
In practice, this means every analytics project proposal should specify, before development begins: which of the three ROI pillars this specific initiative targets, the exact metric and current baseline being measured, the threshold that will constitute success, and who owns tracking that number after go-live. If a business sponsor cannot answer these four questions before signing off on budget, the project is not ready to start — regardless of how technically ready the data or the team may be.
Start With a Pilot, Not a Platform
Analytics programmes that build durable executive support rarely start with a comprehensive, organisation-wide platform rollout. They start with one high-impact pilot, narrowly scoped, measured relentlessly against a pre-agreed threshold, and expanded only once it has proven value in production. A retail analytics engagement that begins with a focused inventory-optimisation model, proves a specific, defendable cost-avoidance number within the first quarter, and only then expands into demand forecasting, then dynamic pricing, then supplier negotiation analytics, builds a compounding case for continued investment that a single, sprawling year-one platform rollout almost never achieves — because each layer of the pilot-first approach is already carrying its own proof of value into the next funding conversation.
Who Should Own the Number After Go-Live
A success metric with no named owner tends to quietly stop being tracked within two or three months of go-live, regardless of how carefully it was defined during discovery. The analytics team that built the model or dashboard is rarely the right long-term owner of the business outcome metric — they own the technical health of the system, not the pricing decision, the inventory order, or the retention offer the analytics is meant to inform. The business function that consumes the insight — sales, operations, finance, or supply chain — should own the outcome number, with the analytics team retaining ownership of the underlying technical metrics that diagnose whether a shortfall is a business-adoption problem or a platform problem. Naming this ownership explicitly during discovery, alongside the metric and threshold itself, is what keeps a defined success metric from quietly becoming an orphaned dashboard nobody revisits after the initial launch excitement fades.
Looking Ahead: How ROI Measurement Itself Is Evolving
The measurement discipline this framework describes is itself becoming more automatable. Early-stage analytics ROI tracking typically starts with manual, spreadsheet-based before-and-after comparisons against a baseline — genuinely sufficient for a first pilot, and far better than no measurement at all. As programmes mature, the more advanced pattern emerging through 2026 is automated outcome tracking layered directly onto the analytics platform itself: usage data, decision-linked outcome data, and cost data flowing into the same reporting layer that produced the original insight, closing the loop between "we built a model" and "here is the dollar figure it generated this quarter" without a separate manual reconciliation exercise.
The organisations reaching this more advanced stage are treating measurement infrastructure as part of the analytics investment itself, not an afterthought bolted on when a board eventually asks for proof. Boards and CFOs are increasingly asking not just for a productivity or efficiency percentage, but for a defensible, auditable link between a specific decision an analytics system informed and the financial outcome that followed — and building that traceability from day one is materially cheaper than retrofitting it after the fact.
How VeeTee Structures Analytics Engagements Around Provable ROI
VeeTee'sdata analytics practicedefines success metrics during discovery, before a single line of code is written or a singlePower BI dashboardis designed. Every engagement proposal specifies which ROI pillar the project targets, the exact baseline and threshold, and the tracking mechanism that will report against it post-launch — so that six months after go-live, the answer to "what did this actually deliver" is a specific number your finance team already trusts, not a usage statistic assembled under pressure.
Frequently Asked Questions
Why do most business intelligence projects fail to prove their ROI?
Why do most business intelligence projects fail to prove their ROI?
The overwhelming majority fail not because the technology is broken, but because success metrics were never defined in business terms before the project started. Teams end up reporting technical and usage metrics — dashboards built, users logged in, query speed — because those are the only numbers that were instrumented, even though none of them answer whether the project changed a business outcome. Defining specific, measurable success thresholds during the discovery phase, before development begins, is the single highest-leverage fix for this pattern.
What are the three types of value an analytics project can actually deliver?
What are the three types of value an analytics project can actually deliver?
Direct Revenue Impact (incremental revenue from a decision the analytics enabled, such as a pricing or cross-sell decision), Cost Avoidance (measurable operating cost reduction, such as lower inventory carrying costs or hours saved from automated reporting), and Risk Mitigation (reduced exposure, such as fraud caught earlier or a compliance gap closed). Every metric an analytics project tracks should map to one of these three pillars — if it doesn't, it is very likely measuring activity rather than value.
When should success metrics be defined for an analytics or BI project?
When should success metrics be defined for an analytics or BI project?
Before development begins, during the discovery or scoping phase — not after the project ships. Locking specific thresholds early means the required tracking and instrumentation can be built into the project scope from day one, rather than retrofitted later. Projects that define success upfront know exactly where they stand within weeks of go-live; projects that postpone this conversation are frequently unable to answer it convincingly months later, once the data needed to prove value was never captured in the first place.
Is it better to launch one big analytics platform or start with a small pilot?
Is it better to launch one big analytics platform or start with a small pilot?
A focused pilot consistently builds stronger, more durable executive support than a comprehensive platform rollout. Starting with one high-impact, narrowly scoped use case, proving a specific and defensible ROI number within the first quarter, and only then expanding into adjacent use cases creates a compounding case for continued investment. A sprawling year-one platform rollout, by contrast, often struggles to isolate which specific component delivered which specific value, making the eventual ROI conversation far harder to win.
What technical metrics should still be tracked even though they don't prove business value?
What technical metrics should still be tracked even though they don't prove business value?
Technical health metrics — uptime, data freshness, query response time, error rate — remain important as diagnostic indicators even though they are not themselves proof of business value. They answer a different, still-necessary question: if a business metric is underperforming, technical health metrics help determine whether the cause is a genuine business or adoption issue, or an underlying platform performance problem. Both metric types belong in a complete analytics scorecard; the failure mode is treating technical metrics as if they were sufficient on their own.
Get in Touch
Contact Us
+91 9500945700
adm@vttech.in
No: 8/65, 1st Floor, Radhakrishnan Street, Shankaran Avenue, Velachery, Chennai, Tamil Nadu – 600042, India.
We’re here to help you !